Bitcoin's volatility has plunged, but extreme price swings are more frequent than in 2018
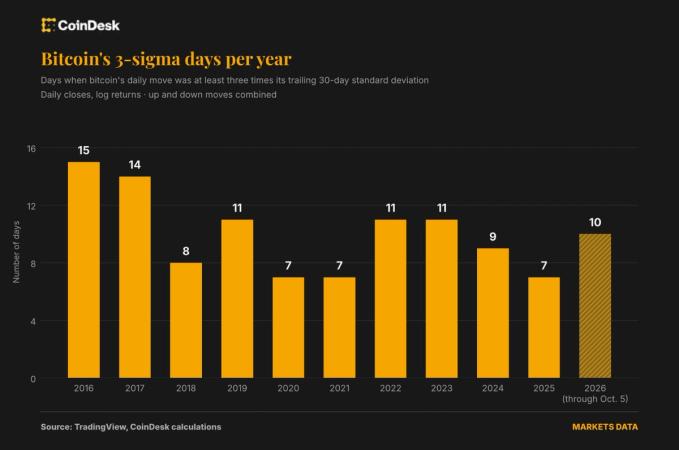
In a normal bell-shaped distribution, about 95% of moves fall within 2-sigma, and 99.7% within three. That makes a 3-sigma move rare, which is why traders use it to flag outsized swings. A high count indicates an asset remains prone to sudden jolts, even if its overall volatility is cooling.
The findings suggest bitcoin has calmed down over the years, but it still has outsized days, and this year it has had them more often than in 2018. This means that bitcoin is experiencing more unusually large moves relative to its recent volatility, even though the moves themselves have become smaller. Bitcoin's annualized volatility is about 46% this year, compared with 84% in 2018, while its 3-sigma moves have averaged roughly 7%, down from about 10% eight years ago.
"Bitcoin still goes through long quiet stretches followed by sharp repricings, and that hasn't changed. The market has matured, with more institutions, ETFs and much deeper liquidity, so the average day is calmer. But the shocks haven't gone away: macro, leverage, positioning," said Nicolas Quatravaux, head of EMEA at Paradigm, the leading institutional liquidity network in crypto derivatives.
This contrast is noticeable even when compared against other volatile assets. Since 2024, bitcoin has been about as volatile as Nvidia, at roughly 47%. Yet it has logged 26 three-sigma days in that time, compared with Nvidia's eight. The S&P 500 had 16, and gold had 12.

Why falling volatility can mislead risk models
The persistence of extreme moves poses a challenge for investors using volatility-based risk models to determine how much bitcoin to hold.